The Trader Desk

Monthly Cycle Returns

See how much interest your money could be making for you each month.

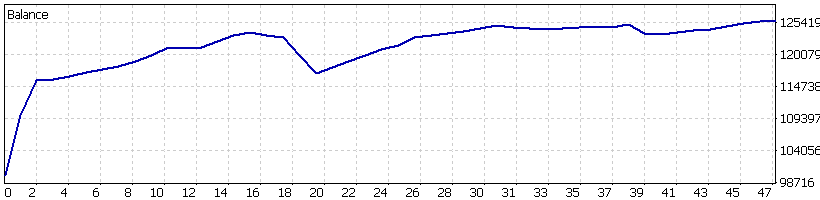
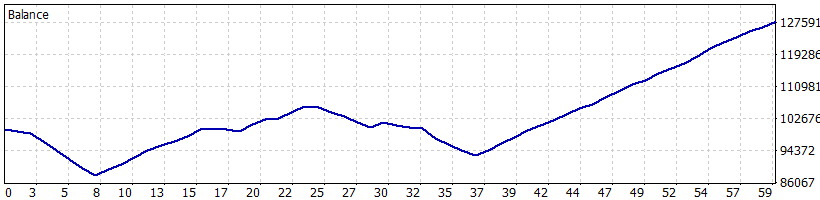
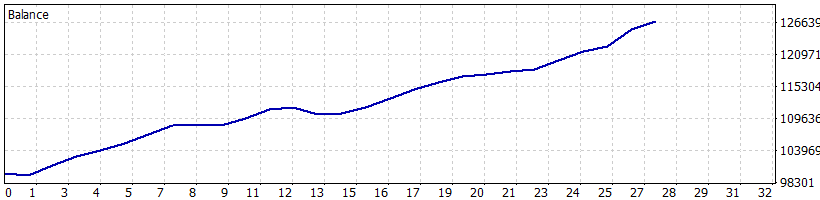
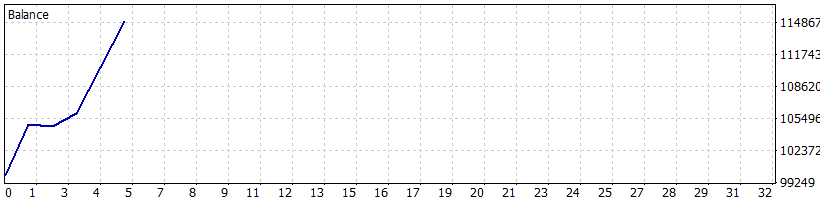
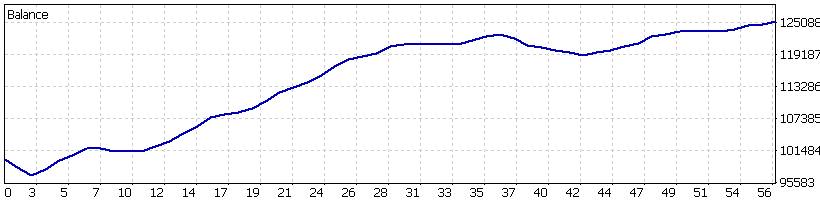
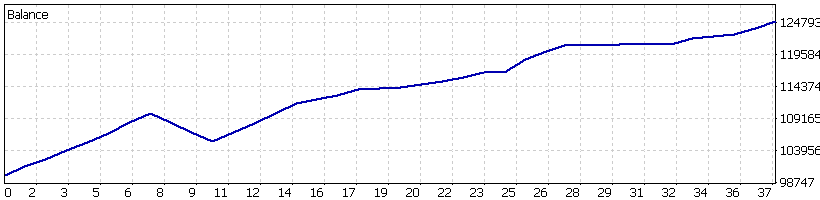
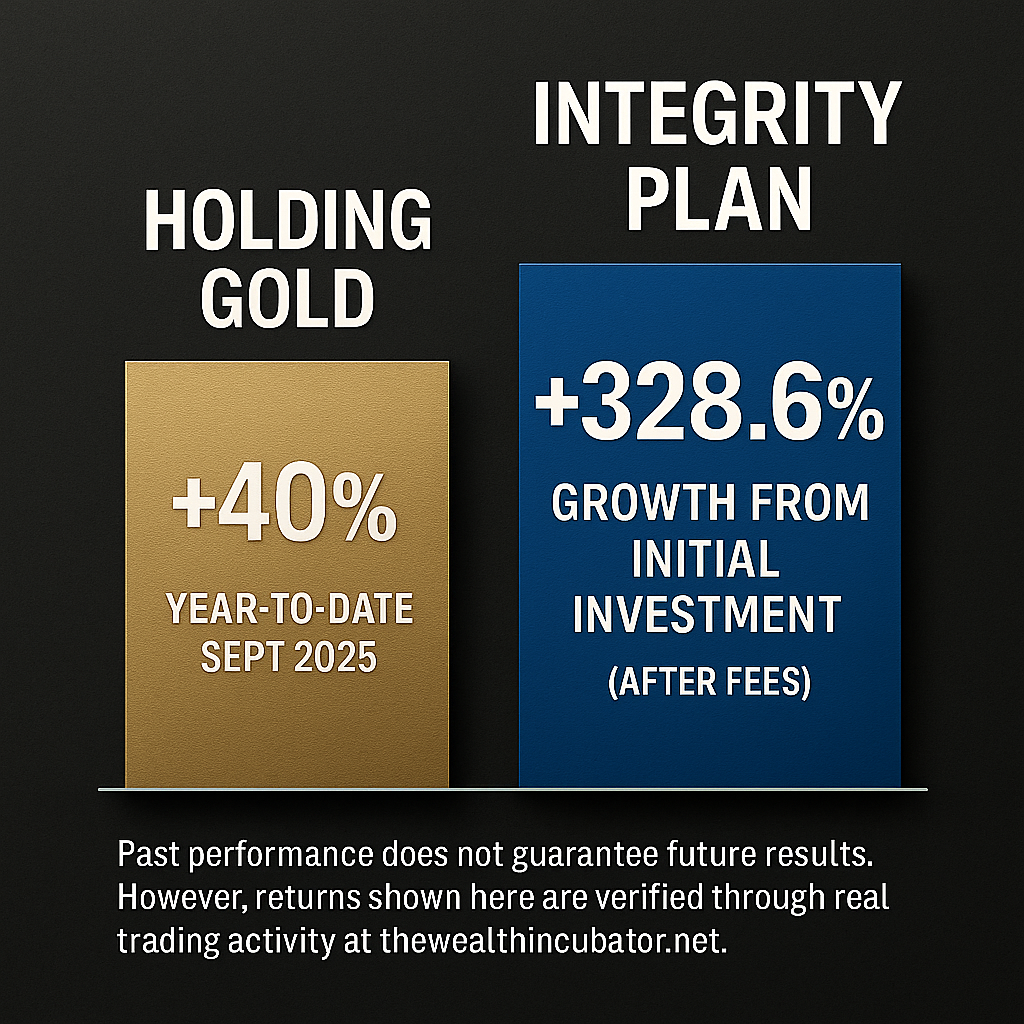
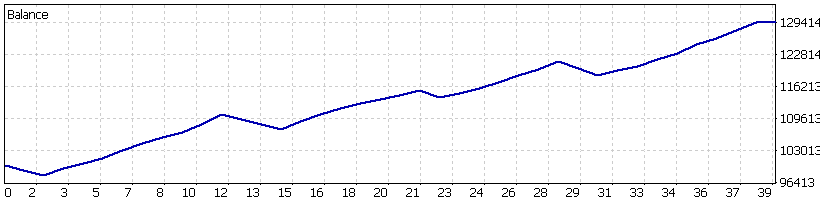
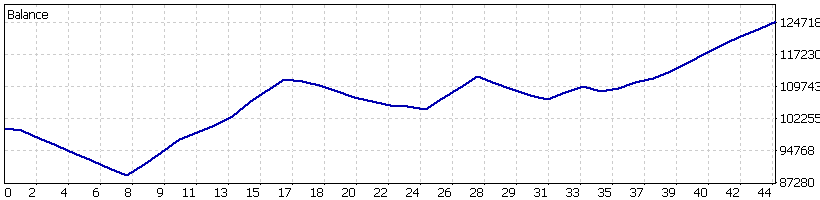
Each month we post the performance history of our trading cycles starting the fiscal year to promote transparency. This insures our member base present or future of the validity of our claims & integrity of our platform.


Note: Each member account connected to the Interface will remotely initiate duplicate trades, but in proportion to the amount of principle in each individual members account.


For Example: If Trader Desk makes 10% within the applicable cycle period then your account will also make 10%, but in proportion to the amount of deposit principle that you have in your account at the beginning of each cycle. Maximal drawdown risk is 25%

Realized Gross Returns to Client (Monthly) — The Integrity Plan

Jauary Cycle 2025

(21.00% Interest Dividend)

February Cycle 2025

(25.68% Interest Dividend)

March Cycle 2025

(28.00% Interest Dividend)

April Cycle 2025

(26.92% Interest Dividend)

May Cycle 2025

(15.02% Interest Dividend)

June - July

Introducing Private Desk

Want more than just 6-25% average monthly? CLICK HERE to learn about our Private Desk.

August Cycle 2025

(25.38% Interest Dividend)

September Cycle 2025

(25.05% Interest Dividend)

Realized Net Returns to Client — Itemized

YTD Sept 25' : Net monthly returns (after 25% fee) + Compounding from $100,000 Deposit.


MonthGross %Net % (after fee)End Balance
Start$100,000.00
Jan21.00%15.75%$115,750.00
Feb25.68%19.26%$138,043.45
Mar28.00%21.00%$167,032.57
Apr26.92%20.19%$200,756.45
May15.02%11.27%$223,371.67
Jun21.00%15.75%$258,552.70
Jul23.00%17.25%$303,153.04
Aug25.38%19.04%$360,858.23
Sep25.05%18.79%$428,654.47
  • Average monthly (gross): 23.45%

  • Average monthly (net after 25% fee): 17.59%

  • Compounded result (Jan–Sep, net): $100,000 → $428,654.47 (+328.65% total ROI; 4.29× multiple)

Holding Gold vs Integrity Plan Leveraging- 2025'

Historical gold “boom / bust / consolidation” patterns & pitfalls:

  • From 2011 to 2019, gold experienced significant underperformance relative to equities. As the CME Group article notes: between 2011 and 2019, equities soared while gold was relatively depressed. CME Group

  • Forbes notes that “During this eight-year period, gold’s price fell ~62%” in real terms (or in certain metrics) while the S&P 500 rose significantly over that span. Forbes

  • Some technical analysts flag warning signs that gold’s current run may echo the 2011 pattern, i.e. strong uptrend followed by a long multi-year consolidation/correction. (“Gold’s Technical Warning Signs Point to 2011-Style Decline”) pilgercoop.com

  • Also, structural headwinds exist: in a “higher for longer” interest rate environment, gold (a non-yielding asset) may suffer if real yields rise. Crux Investor

  • In forecasting commentaries, gold is now viewed as having possibly reset its price floor higher (i.e. new baseline), but the need for periodic consolidations is widely recognized. SSGA+1

Trader Desk Results Continued…

October Cycle 2025

(29.74% Interest Dividend)